
What you will learn
On this pageContentsCloseOpen
Most articles about Shopify profit tracking open with the same claim: Shopify doesn't show your real profit because it ignores ad spend. That's true, and it's also the least interesting thing wrong with native profit reporting.
The expensive problem is quieter. Shopify only reports profit on products that had a cost recorded at the time they were sold. If you launched in January, added Cost per item in June, and pulled a year-to-date margin report in September, the first five months are not wrong — they are simply absent from the report, silently, alongside the net sales figure that doesn't match your sales report. No app can retroactively repair that history from Shopify's data, because Shopify never stored it.
This article covers what Shopify's profit reports actually do, the three gaps that justify a paid app, and how TrueProfit, Juicy Profit Analytics, Profit Calc, and BeProfit price the difference.
What Shopify does natively
More than the comparison articles concede.
Once you record a cost per item on a product or variant, the Shopify admin gives you five default reports under Analytics → Reports, filtered by the Profit Margin category:
- Gross profit by product — net quantity, net sales, cost, gross margin, gross profit
- Gross profit by product variant — the same columns at SKU level
- Gross profit by POS location
- Profit margin by order
- Average profit margin by market
Two of those are better than their reputation. The Shopify Help Center describes both Profit margin by order and Average profit margin by market as covering "the product charges, shipping charges, duties, and import taxes for your customers, as well as product costs, shipping costs, duties, and import taxes paid by your store." Shipping cost is in there. Duties are in there. The widespread claim that Shopify's profit reporting ignores shipping entirely applies to the product-level gross profit reports, not to the order-level one.
The Finances summary report also carries a Gross profit line, and Sidekick can answer profit questions directly — the Help Center gives Show gross profit by product variant for the last 90 days as an example prompt. Sidekick can report gross profit by product, by variant, and by POS location, but not profit grouped by market.
Shopify also handles a subtlety that trips up spreadsheets: the margin shown on a product detail page is based on the product's full price, while Gross margin in the reports is based on net sales, so it reflects discounts and refunds in the period. A $20 T-shirt costing $10 shows 50% on the product page and 33% in the report if you discounted it to $15.
Verdict: if you sell one currency, buy at one landed cost, and want to know which SKUs carry margin, native reports do that. What you are buying from an app is the three things below.
Gap 1: Cost is captured at the moment of sale, and only then
This is the one that costs merchants a year of history.
Shopify's documentation is explicit: "Profit is reported only for products and variants that had cost recorded at the time they were sold." The Help Center repeats the consequence twice, once for the product report and once for the variant report — if orders seem to be missing, those variants had no cost information, and you will "notice a discrepancy between the net sales number displayed in your sales and profit reports."
Entering Cost per item today fixes tomorrow. It does not fix yesterday. And because the same rule governs the Finances summary — only net sales with a recorded cost count toward Gross profit — a partial COGS rollout produces a Gross profit number that looks precise and covers an unknown fraction of the business.
An app installed today inherits the same limitation for past orders, unless it lets you assign a cost retroactively in its own database. That is a real difference between apps, and it is worth asking about before you pay for a year of "historical" analytics.
Gap 2: Cost per item is one static number
Shopify defines Cost per item as what you paid the manufacturer, "excluding taxes, shipping, or other costs." Freight, duty, inspection, and inbound handling are outside the field by definition. If you import, your recorded cost is not your landed cost.
There is no version history either. Shopify says so plainly: "The Cost per item field contains static data, which means that the data in your profit reports is only relevant to a specific point in time." Its own suggested remedies are an ERP or accounting system, a reporting app from the App Store, or calculating manually. And if a product has variants, each variant must be edited individually to carry a cost.
So a store whose supplier price moved three times this year has one number in Shopify and three in reality.
Gap 3: The fees are in a different report than the margin
Card processing costs are not absent from Shopify — they are just somewhere else. Shopify Payments fees appear in the Shopify Payments activity report and the payout reconciliation report, not in the Profit Margin reports. Ad spend, app subscriptions, payroll, and software are nowhere in the admin at all.
Assembling a monthly net profit figure natively means exporting from three places and reconciling them by hand. That reconciliation, done nightly and automatically, is the actual product these four apps sell.
The four apps, and what each one bills on
All pricing below was read from the English (US) Shopify App Store listings on September 5, 2026. All charges are billed in USD.
| TP: True Profit Analytics | Juicy Profit Analytics | Profit Calc: Profit Calculator | BeProfit ‑ Profit Analytics | |
|---|---|---|---|---|
| Built for Shopify | No | Yes | No | No |
| Free plan | No | Yes — 50 orders/month | No | No |
| Free trial | 14 days | 14 days | 15 days | 14 days |
| Entry price | $35/month | $29/month | $39/month | $49/month |
| Orders at entry price | 300 | 500 | 500 | 450 |
| Top listed plan | $200/month | $49/month | $249/month | $249/month |
| Over-limit behavior | Per-order surcharge ($0.30 down to $0.07), capped $300–$1,000 | Flat $49 above 500 orders | Not stated on listing | Not stated on listing |
| Annual discount | Not offered on listing | Not offered on listing | 17% | 20% |
| Features gated by tier | Yes — P&L at $60, Marketing Attribution at $200 | No — every plan, including free | No — same features at every tier | Yes — P&L at $99, LTV cohorts at $149, API at $249 |
| Rating (reviews) | 5.0 (897) | 4.9 (63) | 5.0 (61) | 4.5 (202) |
The column that matters most is the second-to-last. Two of these apps sell you order volume; two sell you order volume and features. On TrueProfit, marketing attribution — arguably the reason you wanted profit-by-ad-spend in the first place — sits on the $200 Enterprise plan. On BeProfit, the P&L report starts at $99. Juicy and Profit Calc both ship the same feature set at every price point and charge purely for throughput.
Same store, two sizes, four bills
Take a single-storefront US brand and price it at two volumes, using the cheapest plan on each listing that covers the volume.
At 400 orders per month:
| App | Plan | Monthly |
|---|---|---|
| Juicy Profit Analytics | Starter | $29 |
| Profit Calc | Starter | $39 |
| BeProfit | Basic | $49 |
| TrueProfit | Advanced (600 orders) | $60 |
TrueProfit's Basic plan at $35 covers 300 orders; the extra 100 at $0.30 each adds $30, which makes the $60 Advanced plan cheaper than the $65 you'd pay by staying on Basic. That crossover is easy to miss and is not flagged in the app.
At 2,000 orders per month:
| App | Plan | Monthly |
|---|---|---|
| Juicy Profit Analytics | Advanced | $49 |
| Profit Calc | Pro (3,000 orders) | $149 |
| TrueProfit | Ultimate + 500 surcharge orders | $150 |
| BeProfit | Plus (unlimited orders) | $249 |
Same job, same store, and a five-fold spread. Juicy's top listed tier is a flat $49 for everything above 500 orders per month, which is the single most consequential pricing difference in this category and the reason its listing deserves a look even if you have never heard of the developer.
One caveat worth stating plainly: neither the Profit Calc nor the BeProfit listing states what happens when you exceed a plan's order allowance, so the BeProfit figure above assumes you must move to the plan whose allowance covers you. Confirm that with the vendor before budgeting. The Profit Calc listing also shows its $249 Unlimited plan as "$1,490/year and save 50%" — the same annual figure as the $149 Pro plan — which reads as a listing error rather than an offer.
The apps individually
TP: True Profit Analytics
Source: Shopify App Store (TP: True Profit Analytics), retrieved September 5, 2026
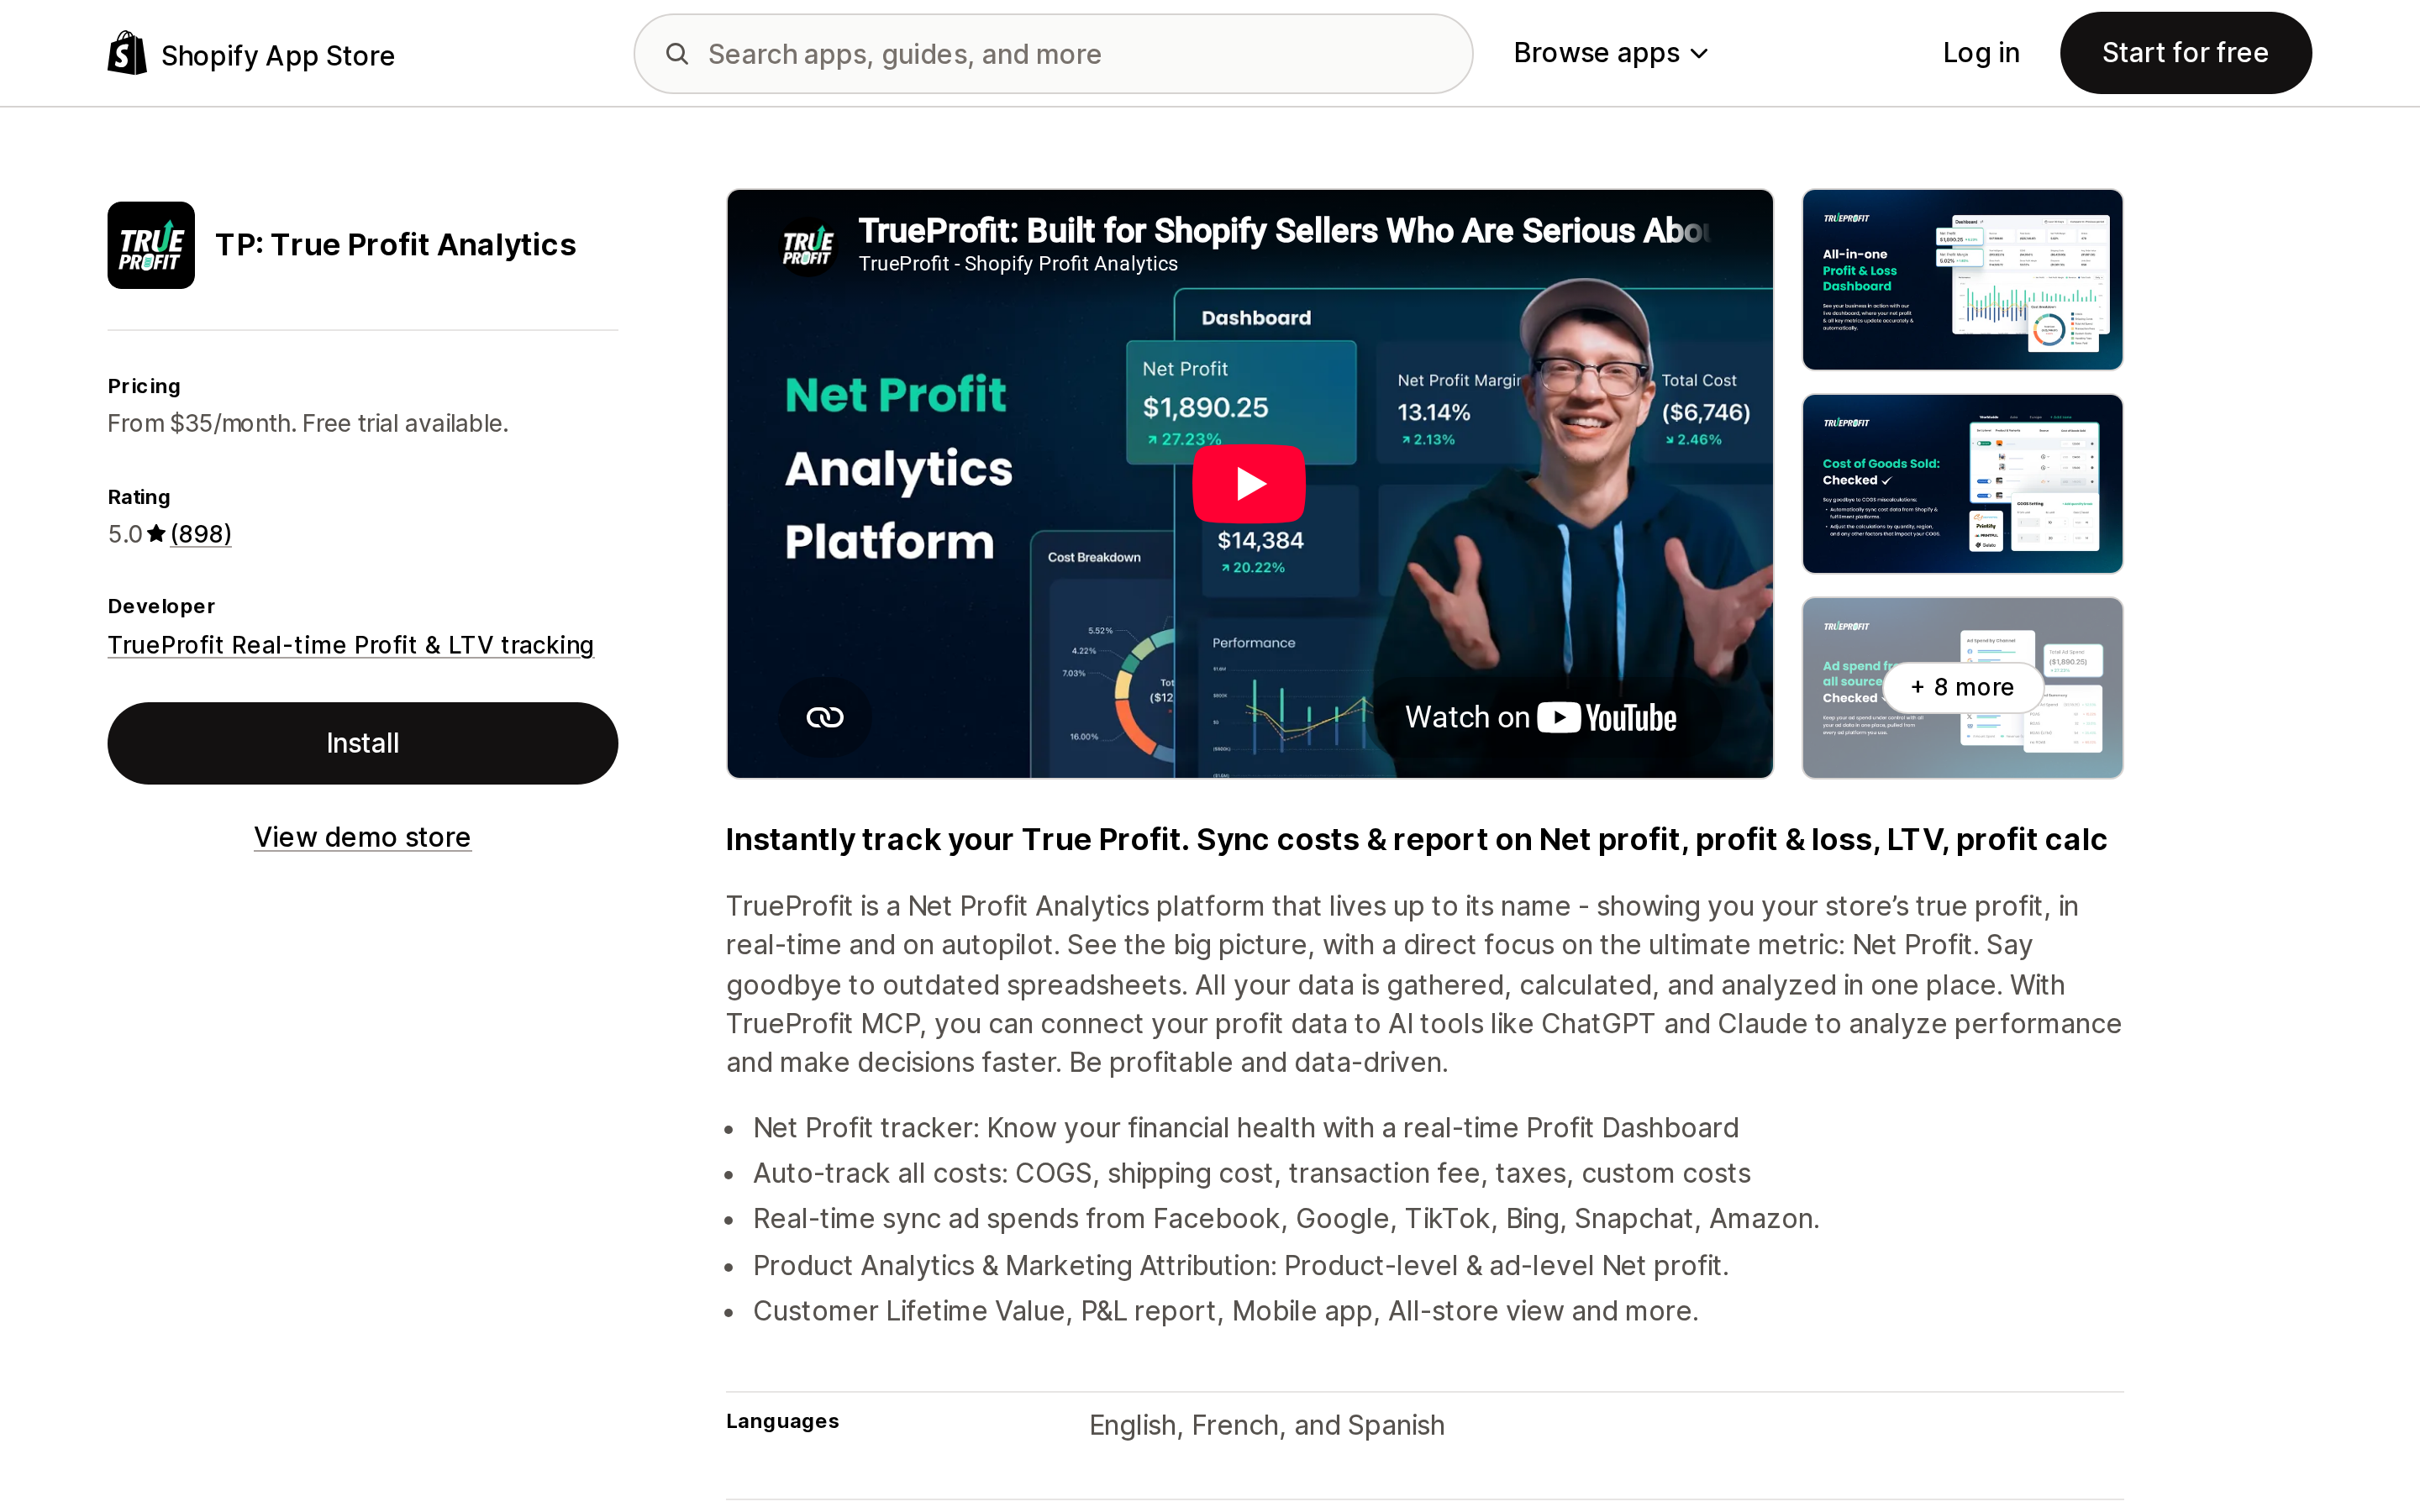
The largest review base in this group by a wide margin — 897 reviews at 5.0, more than four times the next highest count. Launched July 2019, developer FIREAPPS JSC, Ho Chi Minh City. The listing describes automatic tracking of COGS, shipping cost, transaction fees, taxes, and custom costs, with ad spend synced from Facebook, Google, TikTok, Bing, Snapchat, Amazon, Pinterest, and X. It offers quantity-based COGS from the entry plan, weight-based shipping cost, an all-store view, iOS and Android apps, and an MCP endpoint for querying your profit data from ChatGPT or Claude.
The structural drawback is tiering. Product Analytics and the P&L report begin at $60, unlimited COGS zones at $100, and Marketing Attribution at $200. A 400-order store that wants profit-per-campaign is looking at the Enterprise plan.
Juicy Profit Analytics
Source: Shopify App Store (Juicy Profit Analytics), retrieved September 5, 2026
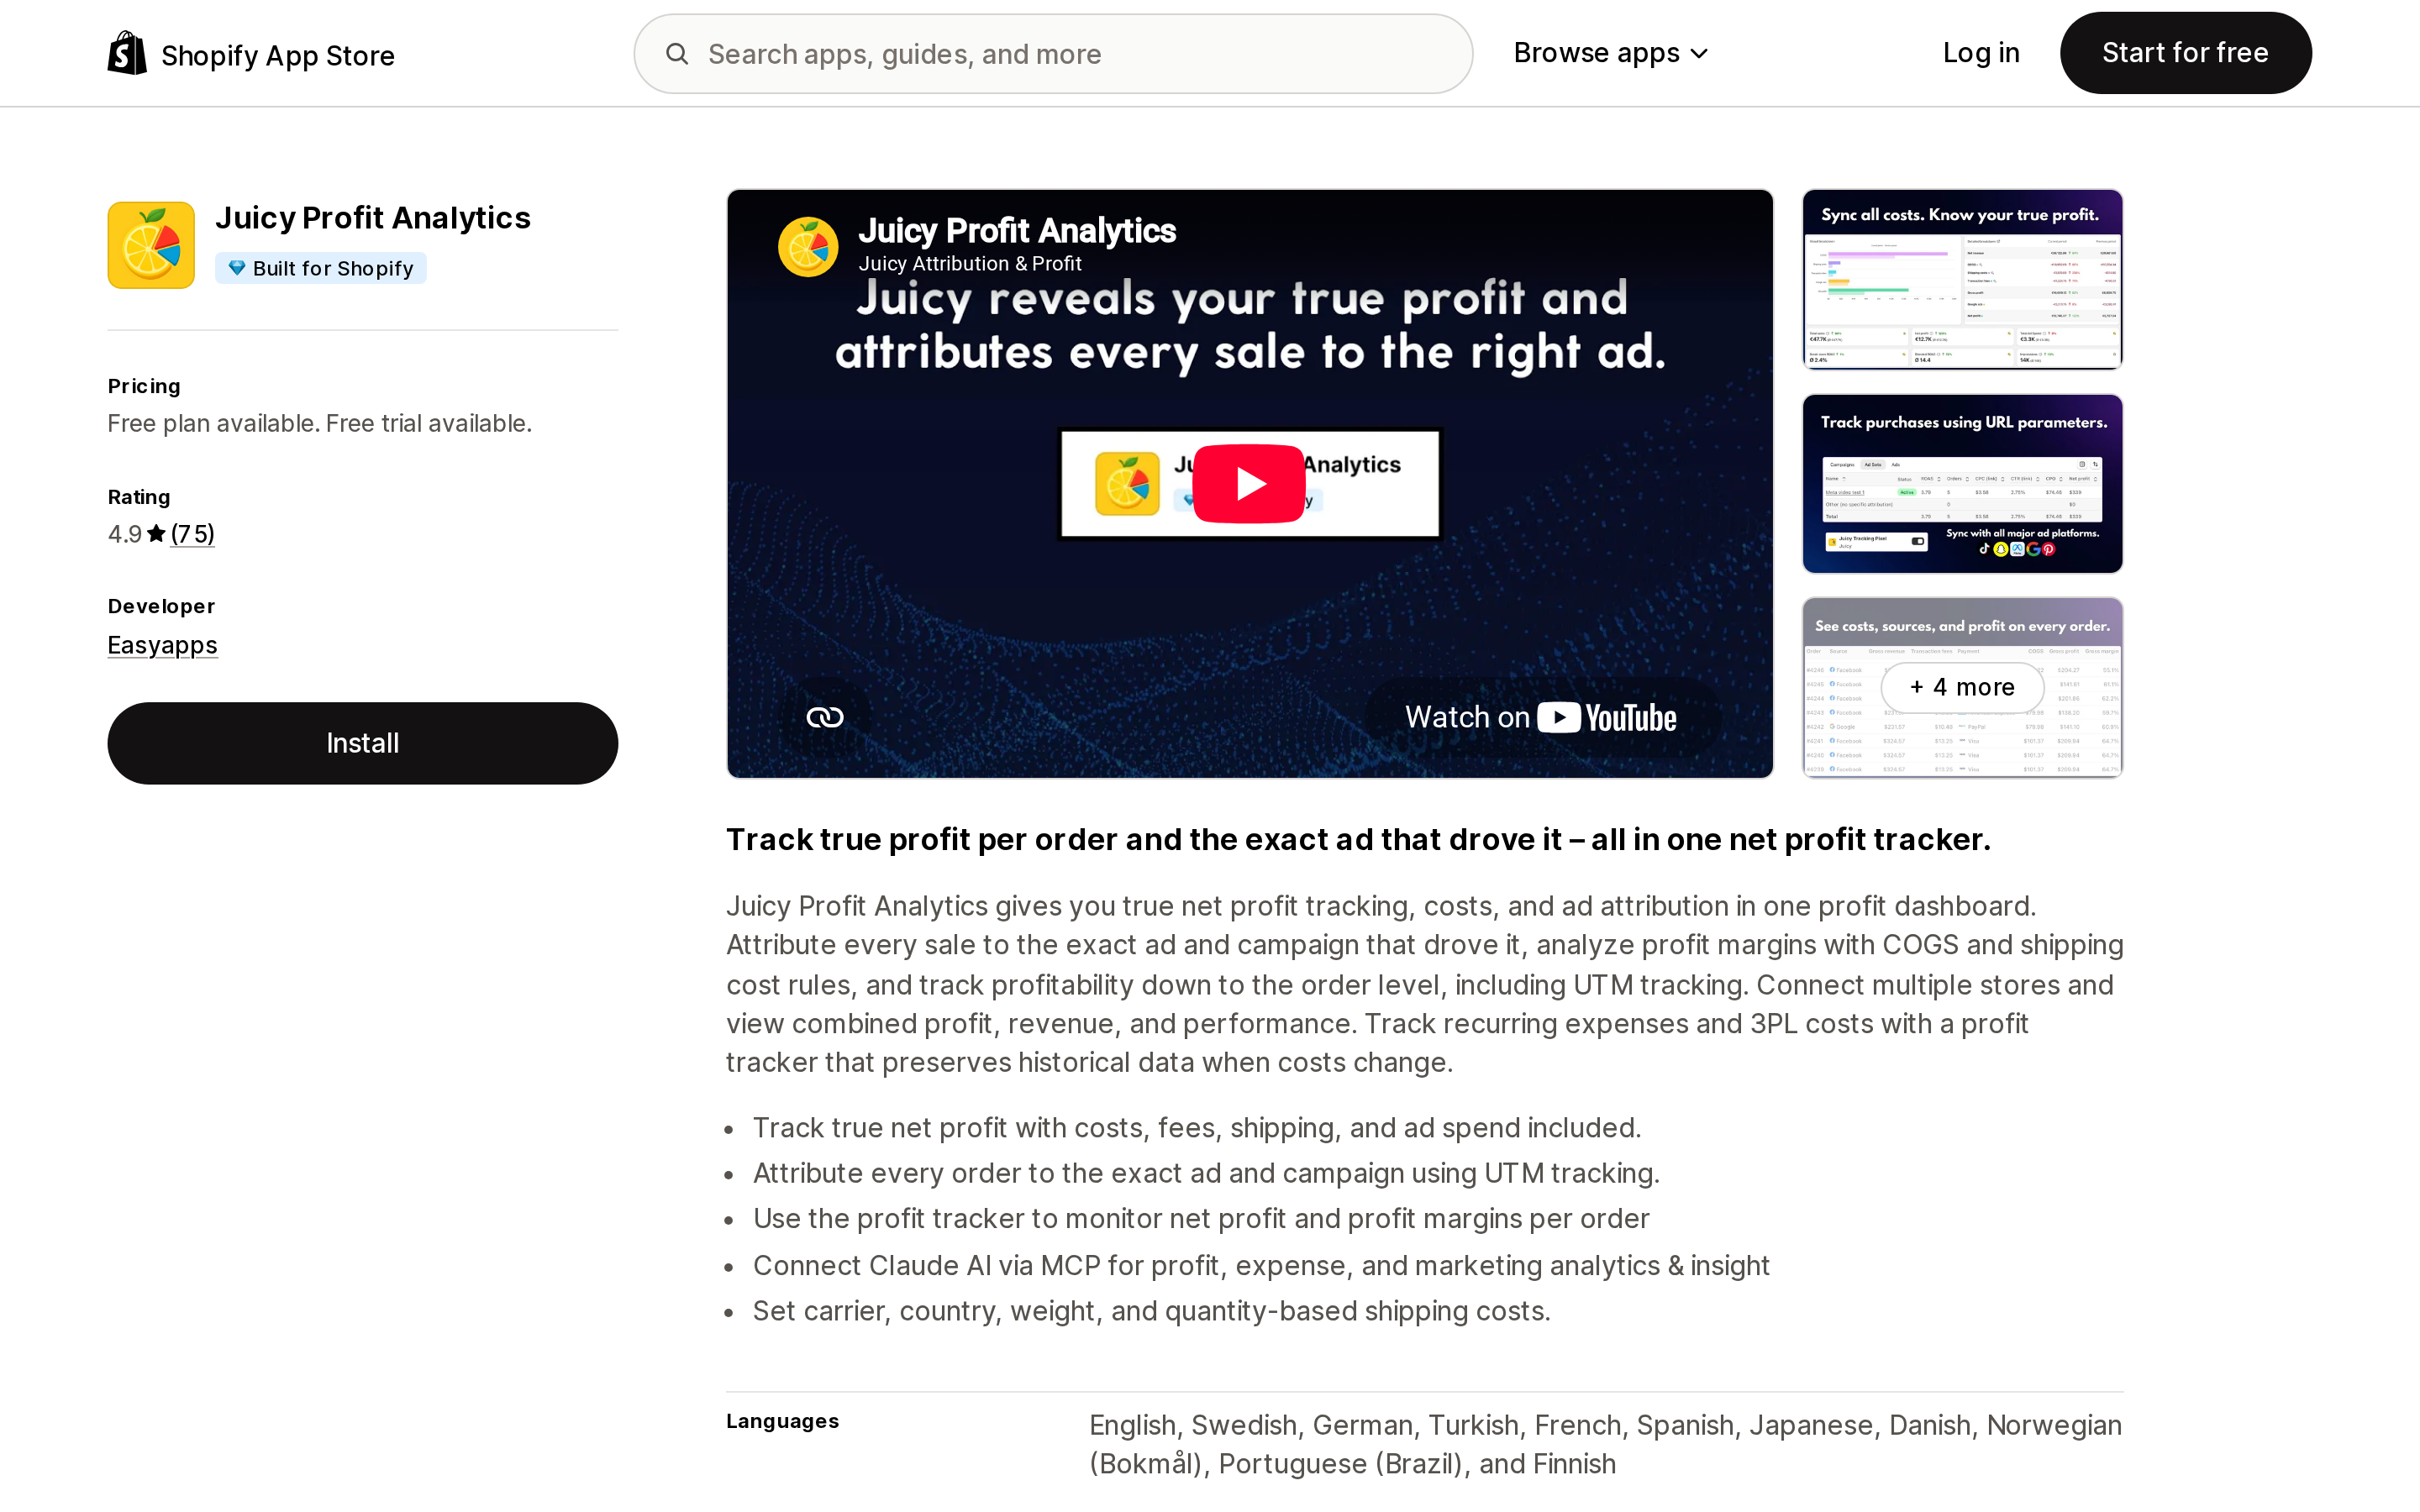
The only Built for Shopify app in this comparison, from Easyapps in Sweden, launched April 2025. Its listing names "Preserve historical profit data" as a feature on every plan including the free one — a direct answer to Gap 2, since it means a supplier price change does not rewrite last quarter's margins. It also offers carrier, country, weight, and quantity-based shipping cost rules, UTM-level ad attribution, multi-store rollups, and a Claude MCP connection.
Two things to weigh against that. The review base is 63 — enough to be indicative, not enough to be representative. And the listing's data access section includes web pixels and the Online Store theme and checkout page, which is broader than a pure back-office reporting app needs; read the privacy policy if pixel-level collection matters to you.
Profit Calc: Profit Calculator
Source: Shopify App Store (Profit Calc: Profit Calculator), retrieved September 5, 2026
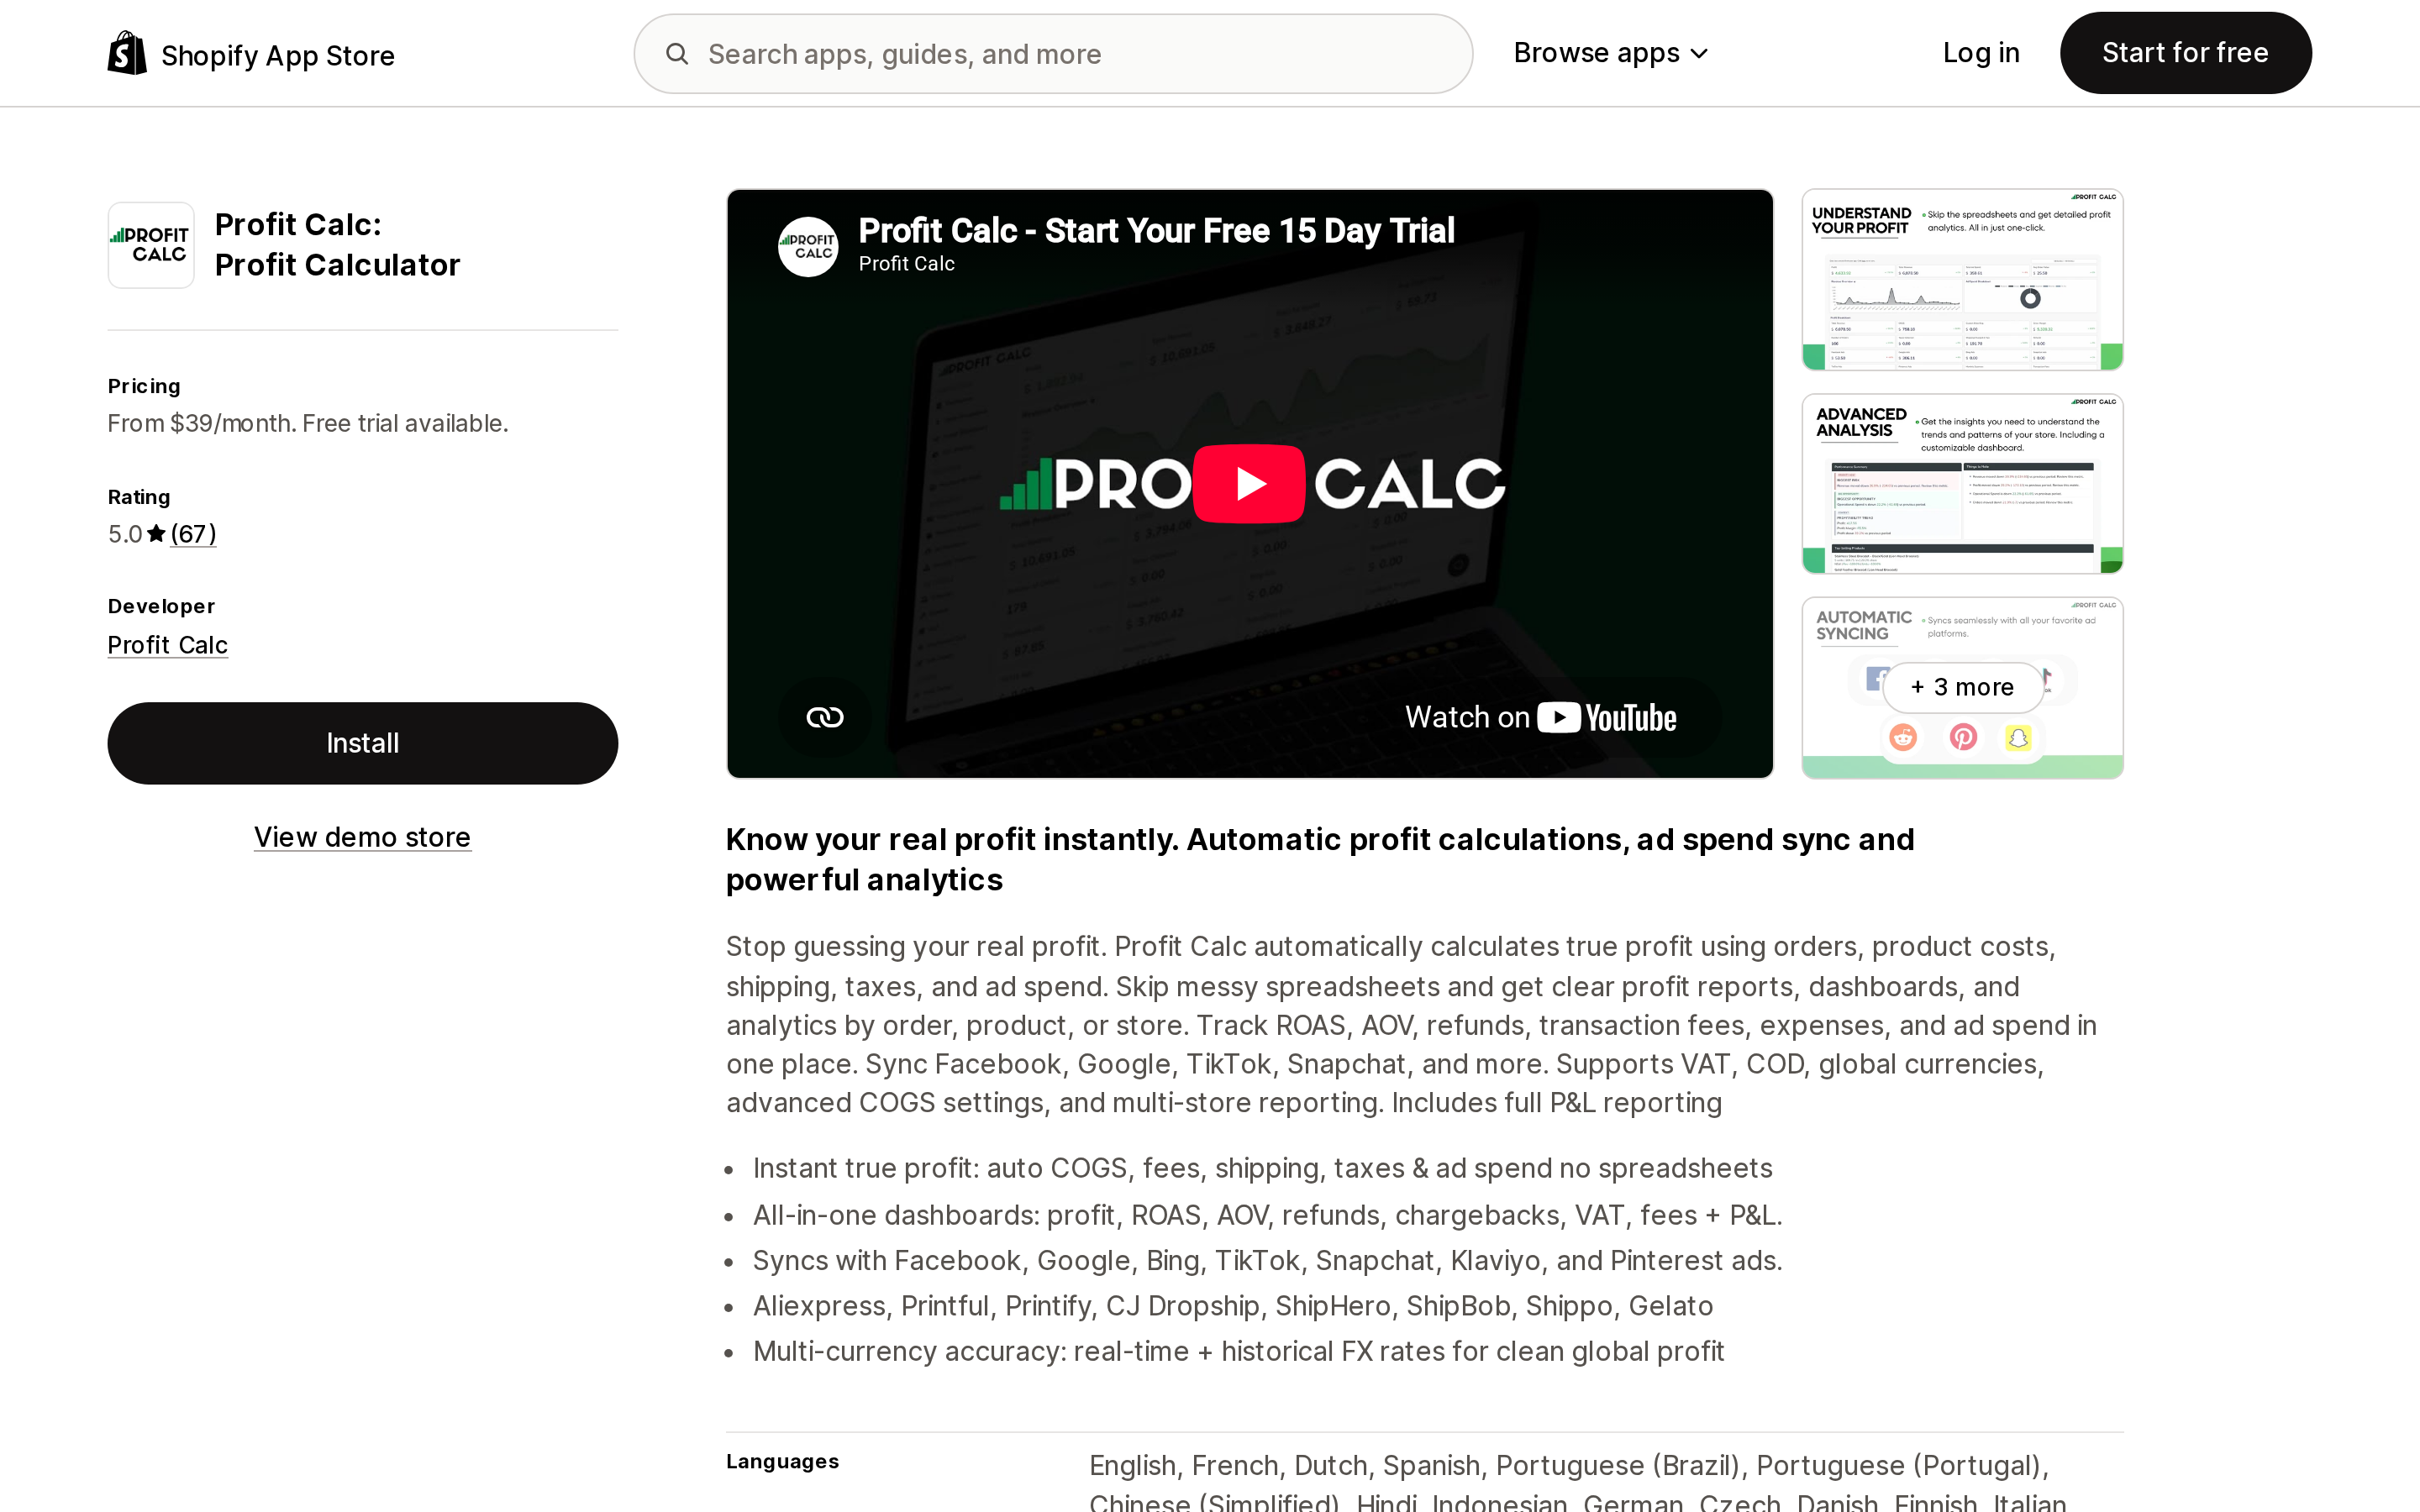
Halifax-based, launched December 2019, 5.0 across 61 reviews, and the longest trial here at 15 days. Its differentiator is cost precision rather than dashboards: COGS rules by country, quantity, and date, plus real-time and historical FX conversion. Date-scoped COGS is the closest thing in this group to fixing Shopify's static Cost per item field, and historical FX matters if you buy in one currency and sell in several. Supplier and fulfillment integrations are unusually specific — AliExpress, CJ Dropshipping, Printful, Printify, Gelato, ShipHero, ShipBob, Shippo — which is where its dropshipping and print-on-demand lean shows.
Each of the three most recent reviews shown on the listing mentions support responsiveness; one US merchant, on September 1, 2026, described a Gelato integration being built within hours of the request. That is one account, not a service-level commitment.
BeProfit ‑ Profit Analytics
Source: Shopify App Store (BeProfit ‑ Profit Analytics), retrieved September 5, 2026
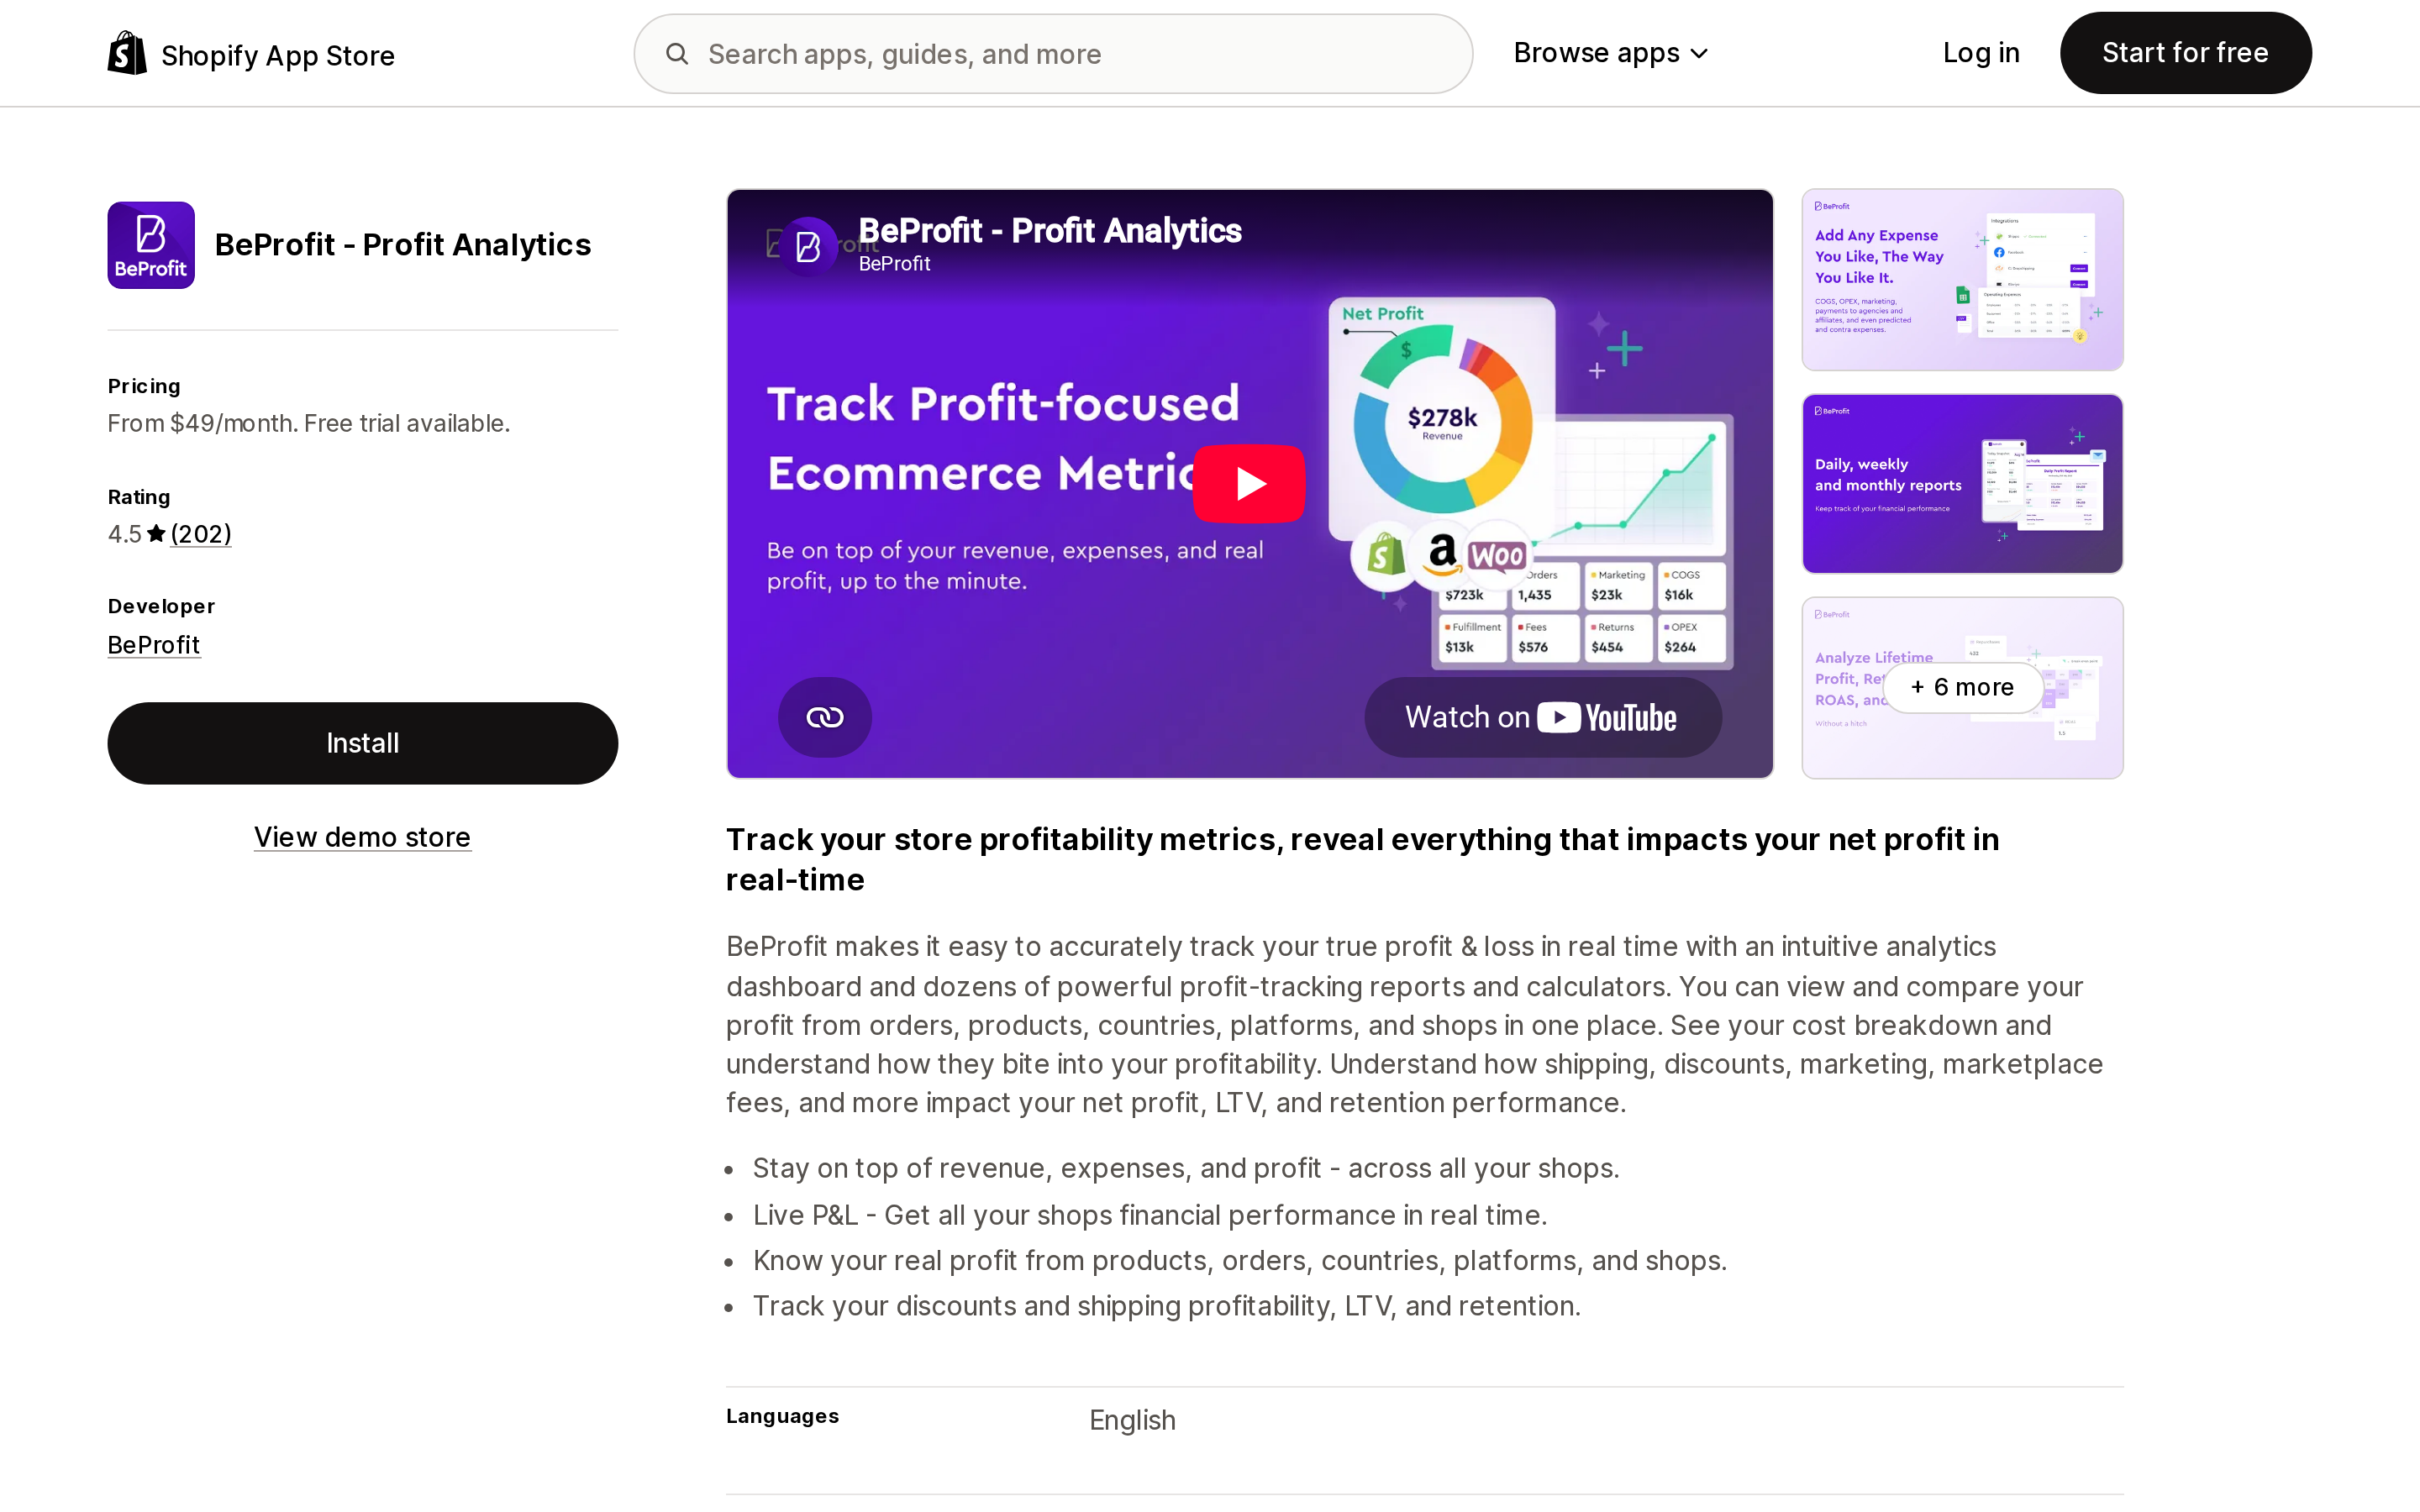
The only one of the four listing a US developer address — Coral Springs, Florida, launched September 2020 — and the only one whose App Store feature tags include Benchmarking and Forecasting, alongside POAS and pricing and profit simulators. It also positions for multichannel: Amazon is a listed integration, and the $249 Plus plan covers unlimited shops and platforms plus API access.
It is also the most expensive entry point at $49 for 450 orders and one shop, and it carries the weakest rating here: 4.5 across 202 reviews, with 6% at one star. At least one of those concerns billing rather than the product: a US merchant wrote on April 22, 2026 that the app had been installed in 2023 and billed at $720 a year without ever being used. Which is, uncomfortably, exactly the class of recurring cost a profit analytics app exists to surface.
When native reporting is enough
Skip the app if all of these hold:
- You recorded Cost per item before you started selling, or you accept that pre-COGS history is gone
- Your product costs are stable, or you don't need last year's margins to reflect last year's costs
- You buy domestically, so recorded cost and landed cost are close enough
- Your paid acquisition is small enough that gross margin and net profit move together
- One person can reconcile fees from the Shopify Payments activity report once a month
If two or more of those fail, the reconciliation work exceeds the $29–$49 entry price of every app here.
Before you install
- Check what your profit reports currently exclude. Run Gross profit by product and compare its net sales total against the Sales report for the same range. The gap is your uncosted revenue.
- Ask whether the app can backfill COGS on historical orders in its own store, and how far back it imports. This is the difference between analytics from today and analytics from launch.
- Price your next twelve months, not this month. Order-band pricing means the app you choose at 300 orders may be the most expensive option at 2,000.
- Confirm the over-limit behavior in writing for Profit Calc and BeProfit, since neither listing states it.
- Add the app's own subscription to its recurring costs once it's running. It is an operating expense like any other, and these tools are the only place you'll see it netted out.
Sources
- Shopify Help Center — Profit reports
- Shopify Help Center — Finance reports
- Shopify Help Center — Shopify Payments activity report
- Shopify App Store — TP: True Profit Analytics
- Shopify App Store — Juicy Profit Analytics
- Shopify App Store — Profit Calc: Profit Calculator
- Shopify App Store — BeProfit ‑ Profit Analytics
All pricing, ratings, and review counts were read from the English (US) App Store listings on September 5, 2026 and change without notice.
Shopify added a Bin name column to the inventory CSV on August 25, 2025. It holds one bin per variant per location, it is created only by CSV import, and it prints on Order Printer pick lists. What it does not do is leave Shopify. Shopify staff confirmed on the developer forum in October 2025 and again in January 2026 that there is no public API access to the field, and the developer forum was still reporting the gap in June 2026. That single fact shapes the whole category: EasyScan and iPacky store bins in metafields, Bins-USA and ShelfPilot store them in their own databases, and a free app called Simple Bin Locations copies metafield bins into order notes so packing slips can show them. Shopify's own multi-bin model, with per-bin quantities and an unbinnedQuantity field, exists today only as a feature preview on development stores. Pricing, plan gates, and where each app keeps the bin data, verified on the Shopify App Store, the Shopify Help Center, shopify.dev, and the Shopify community forums on September 18, 2026.